
It’s pretty exciting to look at your analytics at the end of a great live event and really dig into your metrics to reflect on your results. Chat analytics are a window into your live event’s impact and success, and having access to the right metrics can help you make the most of your live events by providing valuable data and insight.
At Chatroll, our built-in analytics product is the culmination of nearly a decade of experience helping customers run successful live chat events. Without further ado, here are the 5 key metrics you need to track for your next live event:
1. Number Of People Who Attended The Event
This metric is key because it’s the basis for all other live event metrics. Knowing the number of people who joined the event gives you transparency about your audience size and attendance, which is a snapshot of the overall success of your event.
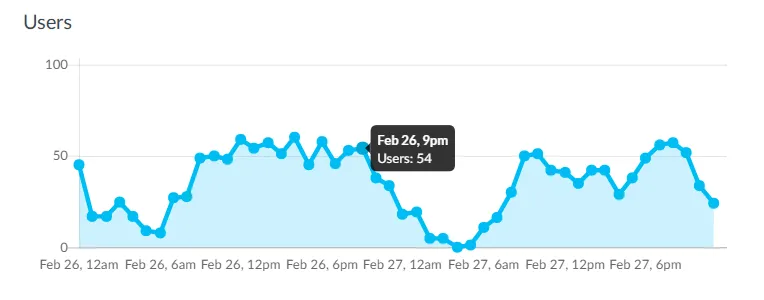
Viewing this metric on an hourly basis shows how your audience size changed throughout your event - providing insights you can use to drive improvements for your next event.
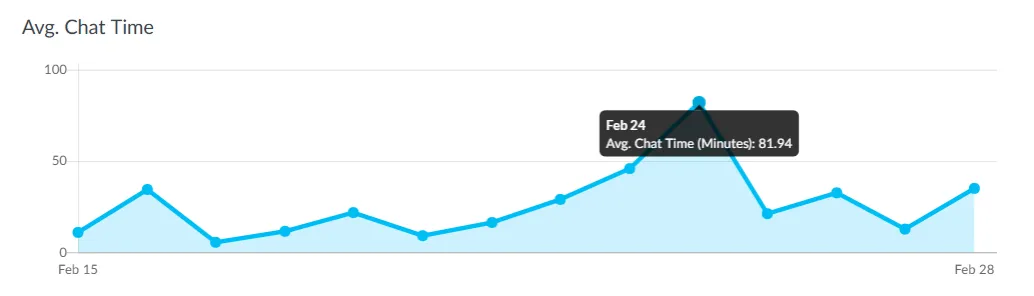
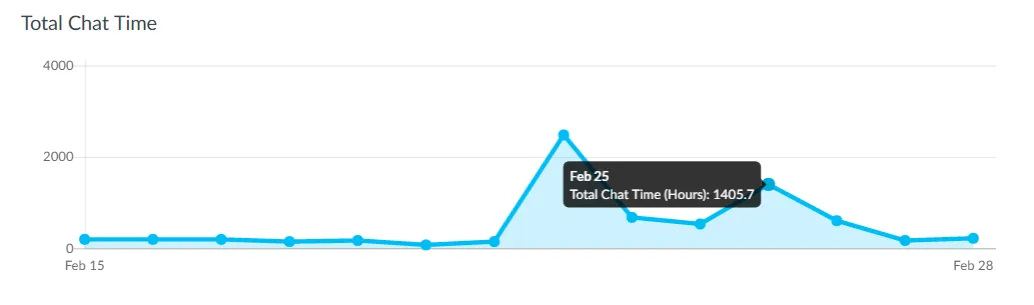
2. Average and Total View Time
By knowing how long people attended your event, you can measure the event’s engagement factor (a.k.a. “stickiness”). When you compare several of your events, you can see which ones held the attention of users longer, and gain insight into which content or engagement efforts had the greatest impact.
Average View Time lets you see the average amount of time users spent in attendance. This is the key metric you want to focus on improving. If Average View Time is increasing from one event to the next, you know you’re getting better at engaging your audience, building a more loyal audience, or (ideally) both.
Total View Time is more of a vanity metric, but has its uses. In the radio industry, this is known as “aggregate tuning hours”. It’s the total (or aggregate) amount of time spent by all users attending your event. Though it may not provide the deep insights the Average View Time metric provides, it’s a great high-level metric to report and celebrate. If this number is growing, it means you’re reaching more people and engaging them longer.
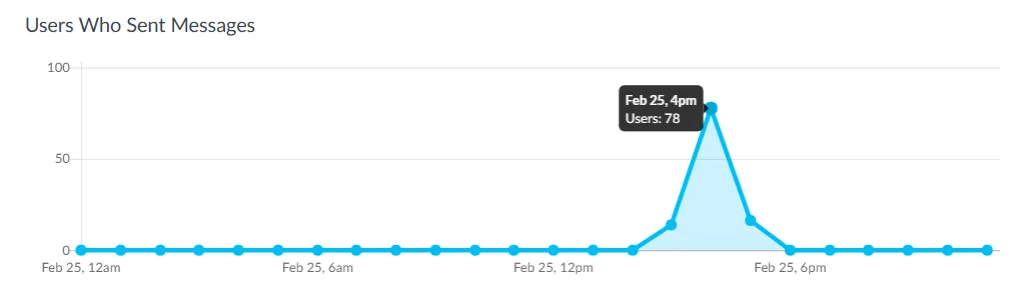
3. Active Engagement Rate
You know how many people joined your event, but how many participated? This metric focuses on people who were more than just casual viewers - it lets you know how many people were so engaged that they became active participants. This is why live chat is so important for live events: it converts inactive viewers into active participants by giving them a way to join the conversation.
4. Number of Users by Sign-In Method
Knowing how people choose to log in to your event allows you to better understand your audience demographics and preferences. This is another way live chat provides data and insight you otherwise would never have access to. Chat is a natural way to incentivize your audience to log in as an actual person you can engage with, rather than just an anonymous viewer.
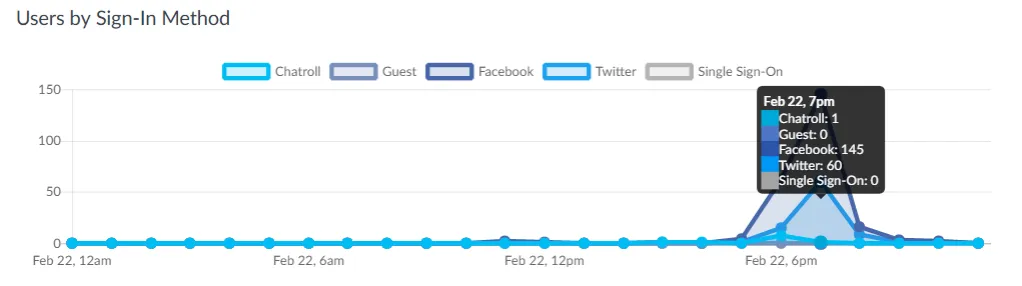
Knowing where your audience is coming from can also help you tailor your live events and marketing efforts. For instance, if most of your audience joins the chat using their Facebook or Twitter accounts, you may want to further target people on those platforms.
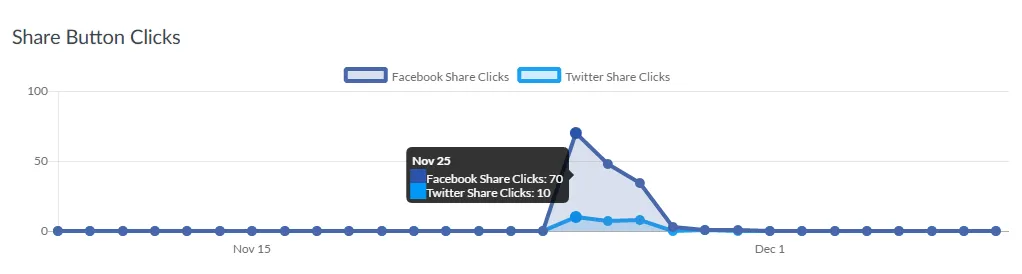
5. Viral Sharing Rate
One factor in measuring the success of your event is knowing its viral impact. Did any of your audience members invite others to your event? Did the size of your audience grow because of interest generated on social media? Encouraging users to promote your event can help to virally grow the size of your audience in real-time. (To learn more, check out our blog post viral marketing through live chat events.)
Conclusion
These 5 key metrics are so popular because they help you measure the success of your live chat events and give you crucial insight into audience reach and engagement. The insights gained can be used to improve your next event and achieve even greater success.